The EU DTC Launch Map │ Where to Test First (Using Meta Library Signals + Store Data)
Europe is not one big homogeneous “EU market.” It’s a patchwork of languages, payment habits, logistics realities, and ad-cost curves. If you expand with a copy-paste playbook, you’ll burn time and budget.
This guide gives you a practical, data-led framework to decide where to test first—by blending Meta Ad Library signals with storefront and logistics proxies—and shows how to centralize your findings in Insights so sales, creative, and ops work from the same source of truth.
Why EU markets behave differently
You’ll see the same categories and ad formats everywhere, but underneath the surface the conversion physics change: CPMs shift by language cluster, payments (local cards, wallets, BNPL, even invoicing conventions in DACH) shape checkout friction, logistics expectations vary (returns windows, shipping SLAs), and compliance (VAT OSS, consent/cookie flows, product claims) can quietly lower conversion if handled poorly.
That’s why ad-level evidence—what actually runs and persists—matters more than hearsay.
A practical market-selection framework (score 0–5 per signal)
Use five observable signals. Keep it fast, directional, and documented.
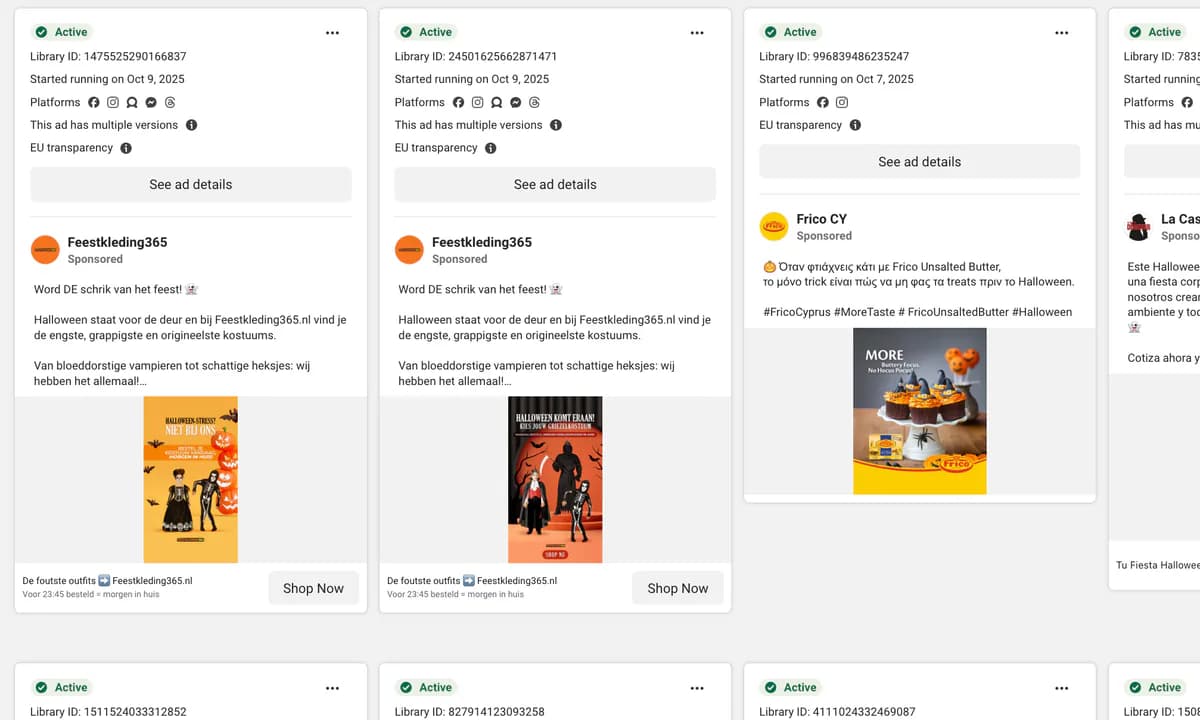
- Library demand signal — Are there multiple advertisers in your niche? Do creatives persist 30–90 days with light refresh? Are there new variants every 7–14 days (healthy testing cadence)?
- Store density proxy — Use storefront counts/indices and category fit to gauge adoption. More peers = cheaper education and stronger cross-category trust cues.
- Price acceptance — Check ad anchors (e.g., “€59 → €49”), bundles, and comments about value. If discount framing repeats across brands, it’s often because it works.
- Logistics feasibility — Cross-border SLA, returns friction, reliable 3PLs, parcel performance; COD pockets; local pickup norms.
- Compliance friction — VAT treatment, consent UX, labeling/claims. You don’t need legal essays—just a realistic traffic-to-checkout path that won’t degrade your CVR.
Score each country, add short reasoning, rank. The score is a decision aid, not a prophecy.
Illustrative country scorecard (replace with your evidence)
Country        Library  Stores  Price  Logistics  Compliance  Total
-------------------------------------------------------------------
Germany (DE)      4       4       3        4          3        18
Sweden (SE)       3       2       4        4          4        17
Denmark (DK)      3       3       3        3          3        15
Finland (FI)      3       3       3        3          3        15
Note: These are placeholders for demonstration. Replace with your own category-specific observations from the Meta Ad Library and store data.
-------------------------
-------------------------
How to read the signals (fast)
- Library demand: Same hook + offer running for weeks? That’s usually a sign unit economics work.
- Store density: More peers = less education cost and often faster trust transfer.
- Price acceptance: Comments, shares, and creative framing (anchor, bundle, scarcity) hint at what price psychology lands.
- Logistics: If shipping/returns are a headache, your CAC balloons to cover trust gaps.
- Compliance: Consent UX and VAT display conventions change real-world CVR. Quiet killers.
The Insights workflow (centralize evidence you can share)
Goal: Make choices defendable and repeatable.
- Create country tags (DE, SE, DK…) and category tags (e.g., beauty-skin, pets-accessories).
- Save 8–12 Library examples per country with screenshots and short notes (format, hook, offer, claims, social proof).
- Add a one-line verdict per ad (win / neutral / lose) with a reason (e.g., “UGC demo + 3-pack bundle crushed comments”).
- End of week: publish a summary—top hooks, anchor ranges, formats to carry forward.
- Your one source of truth now supports creative, media, and expansion in the same place: Insights.
Why it matters: Teams stop arguing tastes and start shipping what the evidence supports.
-------------------------
-------------------------
A two-market, 14-day pilot (budget placeholder €2,000–€5,000)
Day 0–2 — Localize:
- Landing copy by native speaker.
- Payment stack per country (e.g., popular options).
- Price display VAT-inclusive, shipping thresholds set.
Day 3–5 — Launch:
- Each market starts with 6 creatives (UGC + polished; price anchor vs bundle; light scarcity).
- Optimize thumb-stop rate, outbound CTR, View-Content cost first. Cheap attention is table stakes.
Day 6–9 — Trim + iterate:
- Kill bottom quartile. Duplicate top two and swap the first 3 seconds (new hook/cut).
- Keep offer framing constant to isolate creative effect.
Day 10–14 — One lever per market:
- Market A: anchor shift (€59 → €49).
- Market B: bundle shift (2-pack → 3-pack).
- Promote only if CPA holds after the change.
Guardrails: Don’t test five things at once. Give the algorithm a fair shot at learning in each locale.
Localization & compliance checklist (non-negotiables)
- Language & tone: Native copy; avoid machine-literal phrasing that breaks trust.
- Payments: Local wallets/cards; BNPL if normal.
- Pricing & taxes: VAT included; OSS in place; clear shipping thresholds.
- Customer care: Returns norms, response hours, and trust badges that actually mean something locally.
- Creative: Units, imagery, and claims that make cultural sense.
Market decision examples (how the framework leads to action)
- Germany vs Netherlands: DE shows heavier advertiser density (strong demand) but tougher consent friction. NL has simpler payments, fast parcels, and often generous bundle adoption. Start both; scale the one that sustains CPA after day 10.
- Sweden vs Spain: SE often rewards polished-meets-UGC hybrids and quick shipping cues; ES may need stronger price framing and social proof to match. Pick the market that shows positive comment sentiment at anchor price.
- Poland vs Italy: PL can shine with bundles + value anchors; IT needs localized claims and clear returns. Choose the country where your anchor + bundle combo draws fewer “too pricey” comments.
Please note that Insights may not cover all countries mentioned in these examples as of yet. But they are on the roadmap.
Comparison: Manual vs Manual + Insights
| Criterion | Manual-Only | Manual + Insights (recommended) |
|---|---|---|
| Capture & Tagging | Ad-hoc notes | Structured tags + URLs + screenshots |
| Team Visibility | Scattershot | Single source of truth |
| Iteration Speed | Slow | Weekly memos + repeatable sprints |
| Cross-Market Reuse | Low | High (templates, checklists) |
| Decision Rationale | Implicit | Explicit (why we picked Market X) |
What “good” looks like by week two
- Documented: 20–30 saved examples across two markets, each tagged and verdict-ed.
- Directional: A clear angle on anchor vs bundle vs scarcity that your niche responds to.
- Operational: A short localization backlog (payments, returns messaging, top objections).
- Decisive: One market promotes to scale; the other is paused or refit with findings.
-------------------------
-------------------------
FAQs
How many markets should I test at once? Two. It’s the sweet spot: enough contrast, not enough dilution.
What makes a market a “no-go” right now? Weak Library demand and unclear price acceptance and logistics friction at the same time.
Do I need brand-new creatives per country? Start with the same frames, localize language/price/social proof, then branch.
When do I move from test to scale? When CAC stabilizes and comment/DM sentiment aligns with your pricing and claims.
Free Trial: How to Sign Up for Insights - Powered by Trampolin.ai
Start by creating your free 14-day trial account account, pasting your first product URL, and saving examples with tags and notes. No credit card required.
Sign up here: https://insights.trampolin.ai/auth/register
Have questions? FAQ: https://insights.trampolin.ai/faq
Compare plans: Pricing: https://insights.trampolin.ai/pricing